Twarc Utilities for MacOS
This guide is optimized for MacOS users (tutorial for Windows users here).
To use the following utilities, make sure the JSONL file of collected tweet data you want to use is in the same folder as the utils folder (but not inside this utils folder).
For the following twarc lessons, all blue text can be modified to fit your purpose. These are either file names or search/filter terms.
Use the Table of Contents below to quickly navigate this guide.
Table of contents
- Tweet Count
- Convert JSON to CSV
- Users
- Hashtags
- Emojis
- Wordcloud
- Tweet Network Graph
- Create Geojson
- Tweet Wall
- Media URLs
- Remove Retweets from JSONL
- Sort Tweets Chronologically
- Remove Tweets Before Certain Date
- Remove Duplicate Tweets
Tweet Count
To get the total number of tweets in your dataset, enter the command below (*thats a lower-case “L”, not a 1):
wc -l tweets.jsonl
Convert JSON to CSV
Use the following command to create a csv file (spreadsheet):
utils/json2csv.py tweets.jsonl > tweets.csv
Output: Creates a .csv file with the following tweet attributes: Id, tweet_url, created_at, parsed_created_at, user_screen_name, text, tweet_type, coordinates, hashtags, media, urls, favorite_count, in_reply_to_screen_name, in_reply_to_status_id, in_reply_to_user_id, lang, place, possibly_sensitive, retweet_count, retweet_or_quote_id, retweet_or_quote_screen_name, retweet_or_quote_user_id, source, user_id, user_created_at, user_default_profile_image, user_description, user_favourites_count, user_followers_count, user_friends_count, user_listed_count, user_location, user_name, user_statuses_count, user_time_zone, user_urls, user_verified
See the Tweet Data Dictionary for a complete description of these attributes.
Users
To count the number of unique users in the dataset, enter the following command:
utils/users.py tweets.jsonl > users.txt
This will create a text file listing all users in the dataset. To sort the unique users in the dataset by the number of tweets sent by users during the collection period:
cat users.txt | sort | uniq -c | sort -n > users_sorted.txt
To find the total number of unique users counted:
cat users_sorted.txt | wc -l
To find the users with the most tweets in the collection:
tail users_sorted.txt > users_top_ten.txt
Hashtags
To to get a list of all the unique hashtags used in the dataset, enter the following command:
utils/tags.py tweets.jsonl > tweets_hashtags.txt
To get the total number of unique hashtags used in the dataset:
cat tweets_hashtags.txt | wc -l
To find the top ten hashtags used in the dataset:
head tweets_hashtags.txt > hashtags_top_ten.txt
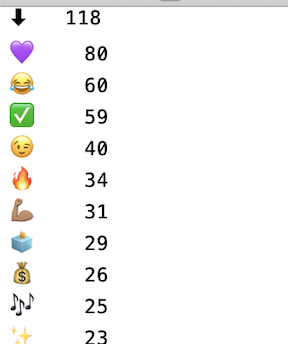
Emojis
To see a list of all emojis in the dataset, use the following command:
utils/emojis.py tweets.jsonl > tweets.txt
Output: Creates a text file with all emojis and number count:
Wordcloud
To create a wordcloud, use the following command (see note below):
utils/wordcloud.py tweets.jsonl > wordcloud.html
Output: Creates an html file, open in your browser to see wordcloud.
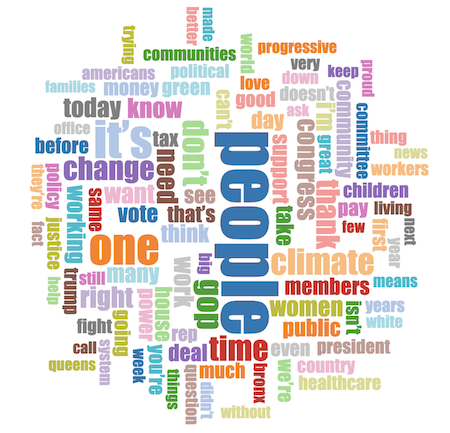
Note on wordclouds: Consider removing retweets from your dataset when creating your wordcloud. With retweets included, the text from the original tweet is shortened in the dataset, and can create odd/deceptive wordclouds.
Example:
| From original dataset: | After retweets removed: |
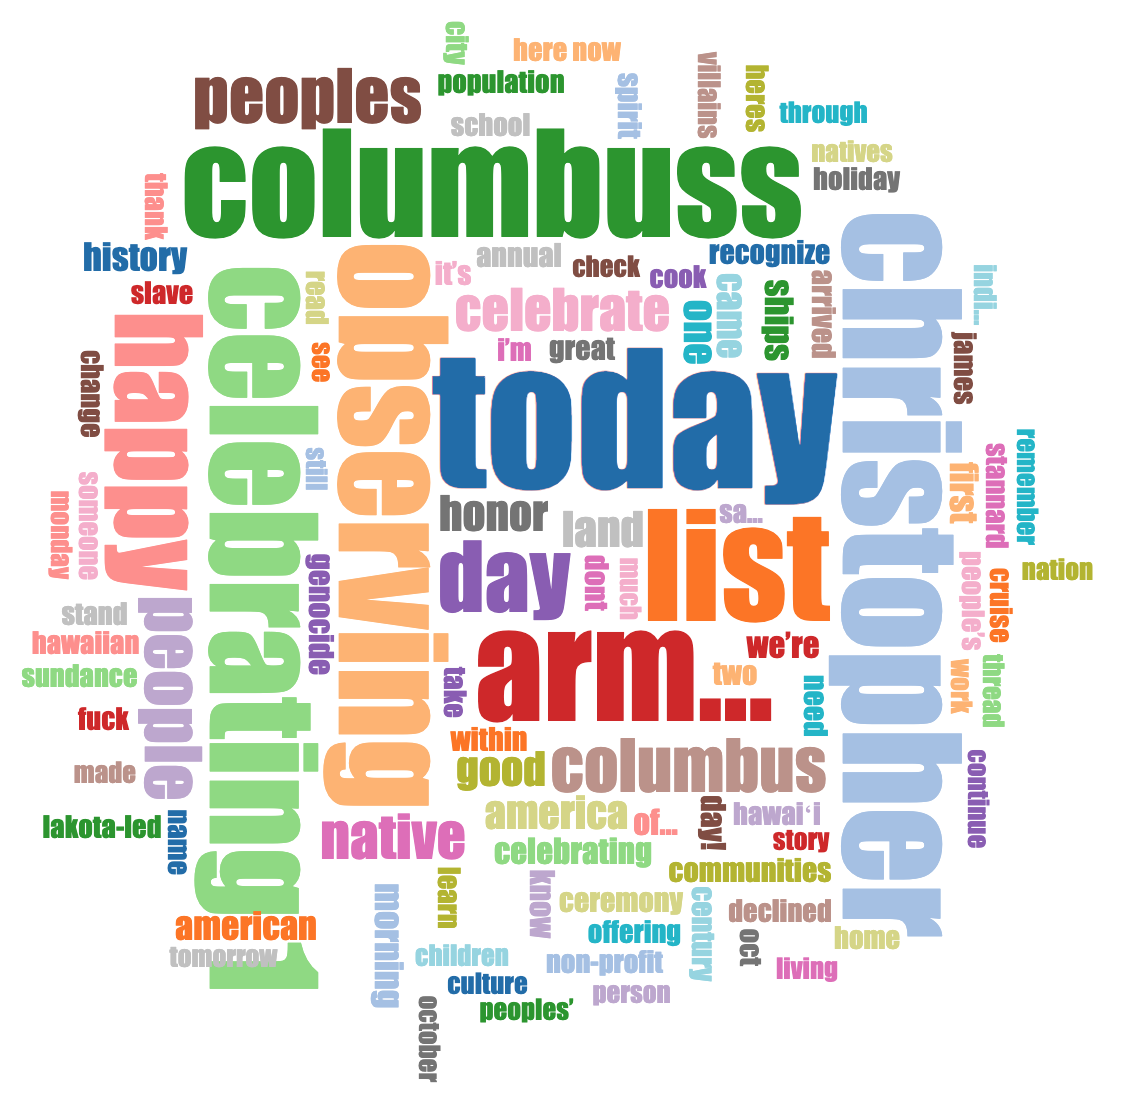 |
 |
That large red “arm…” in the original dataset was from a highly retweeted tweet, where the word “army” was cut off mid-word in the retweet data.
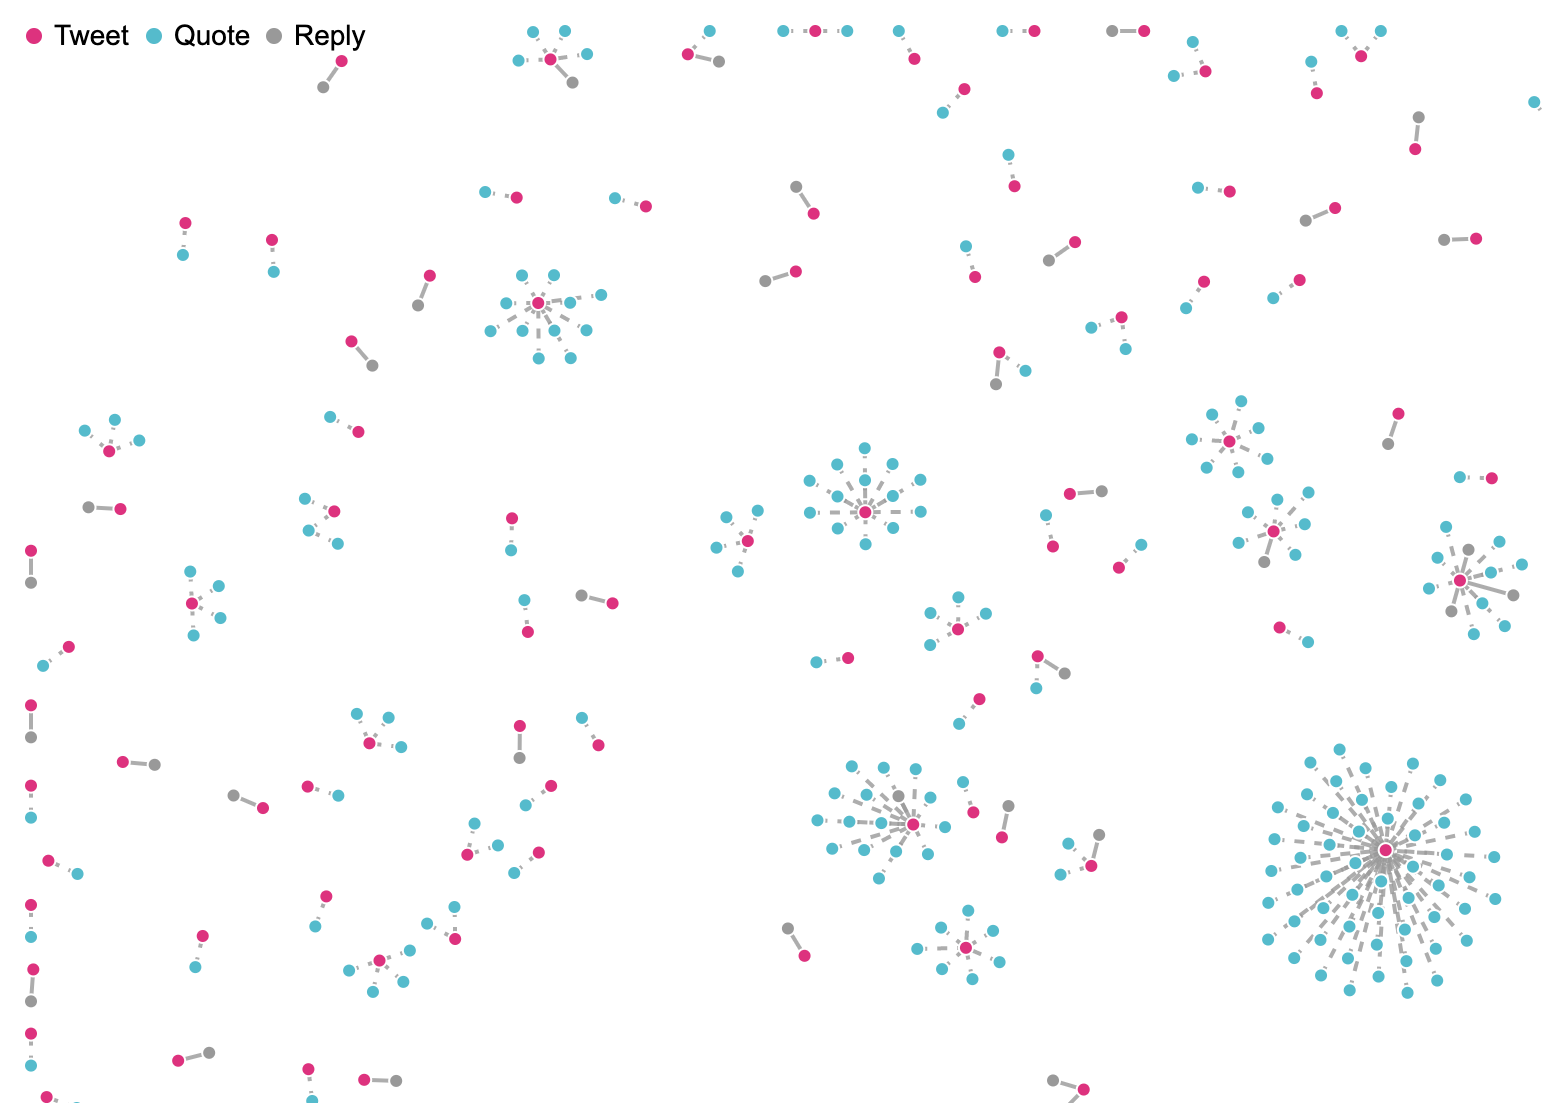
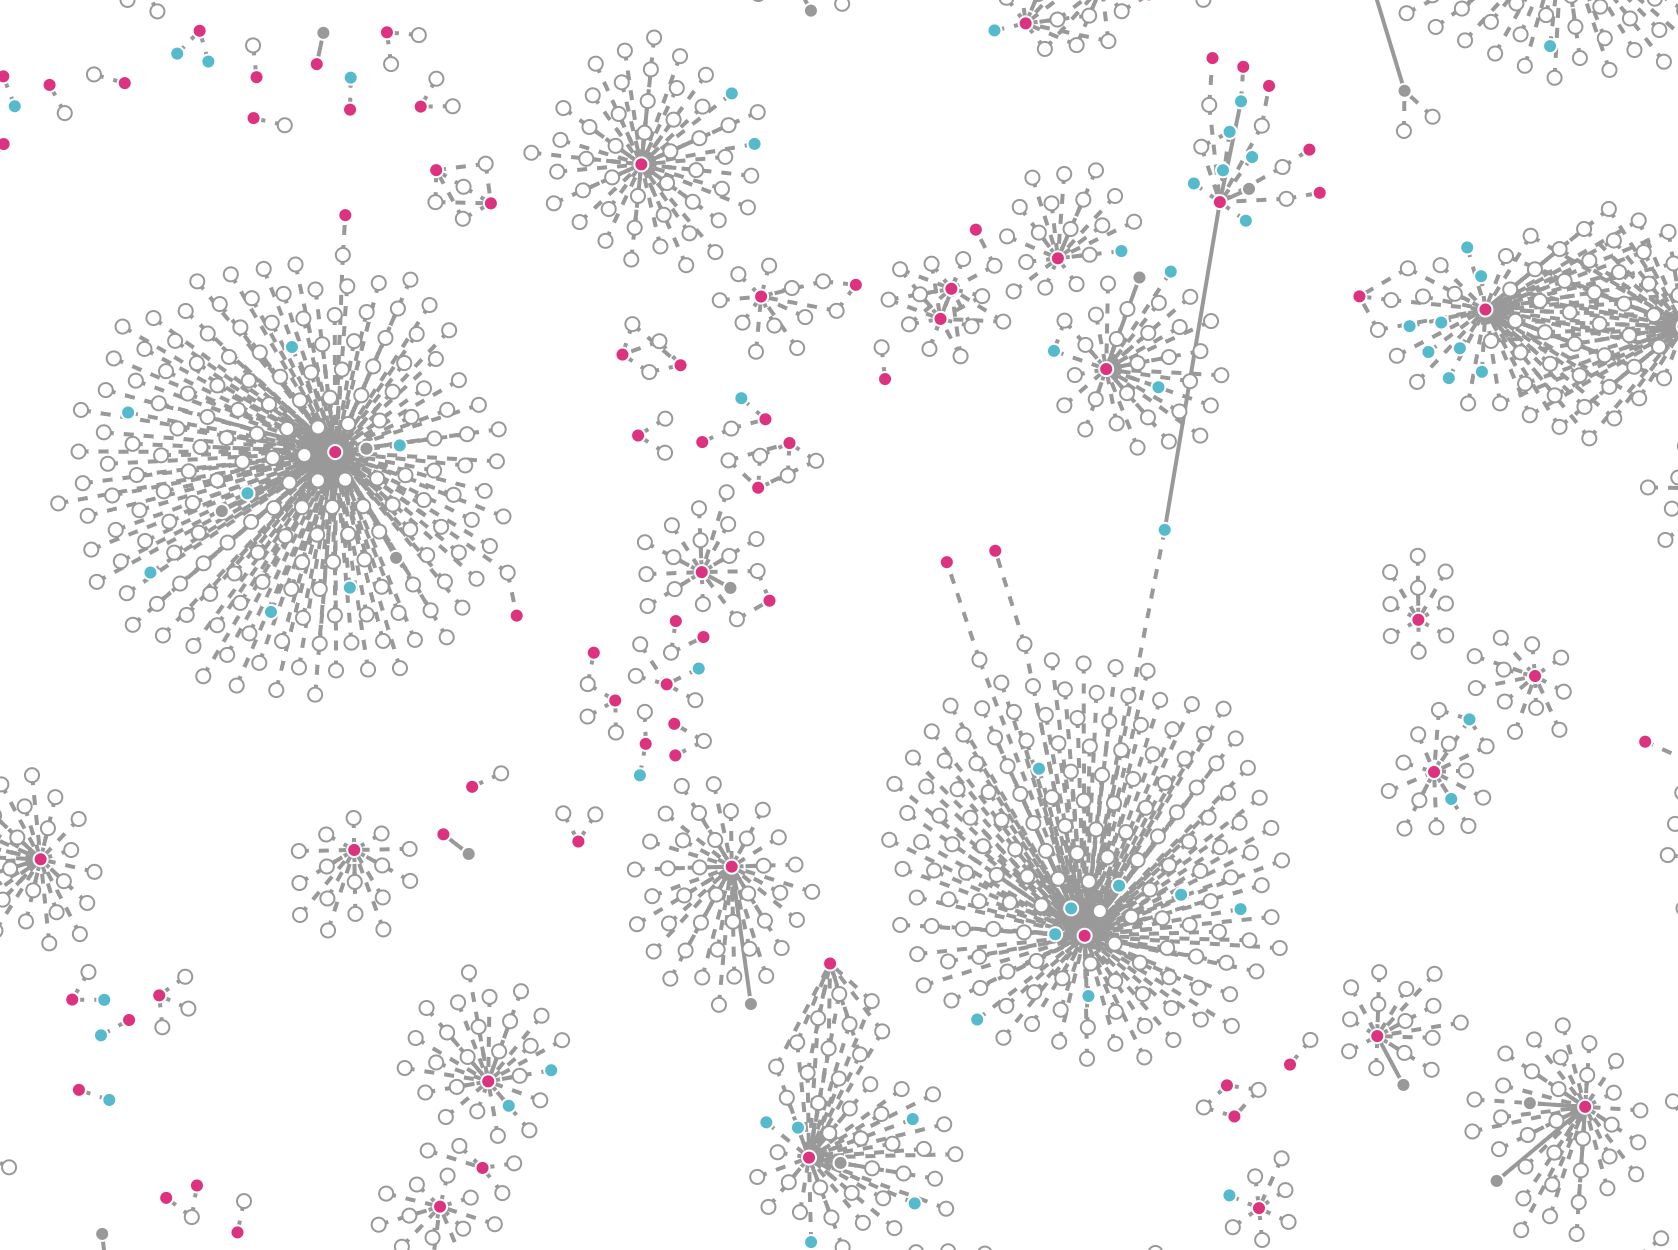
Tweet Network Graph
Create a network graph from your tweet data, use the following command (note there is no ‘>’ in this command between the jsonl file name and the html file name):
utils/d3_network.py tweets.jsonl tweet_graph.html
Output: Creates an html file, open in your browser to view the network graph of your tweets. This script only shows a graph of original tweets that have been quoted and/or have replies (not the entire dataset). Hover over circles to show connections, click to show tweet (if you click and no tweet appears, it was likely deleted or set private)
To include retweets in your network graph, use the following command (if you have a very large dataset, this will take a long time to load, and may be too crowded to read well):
utils/d3_network.py --retweets tweets.jsonl tweet_graph.html
Output: an html file of your network graph, including retweets. Open in browser:
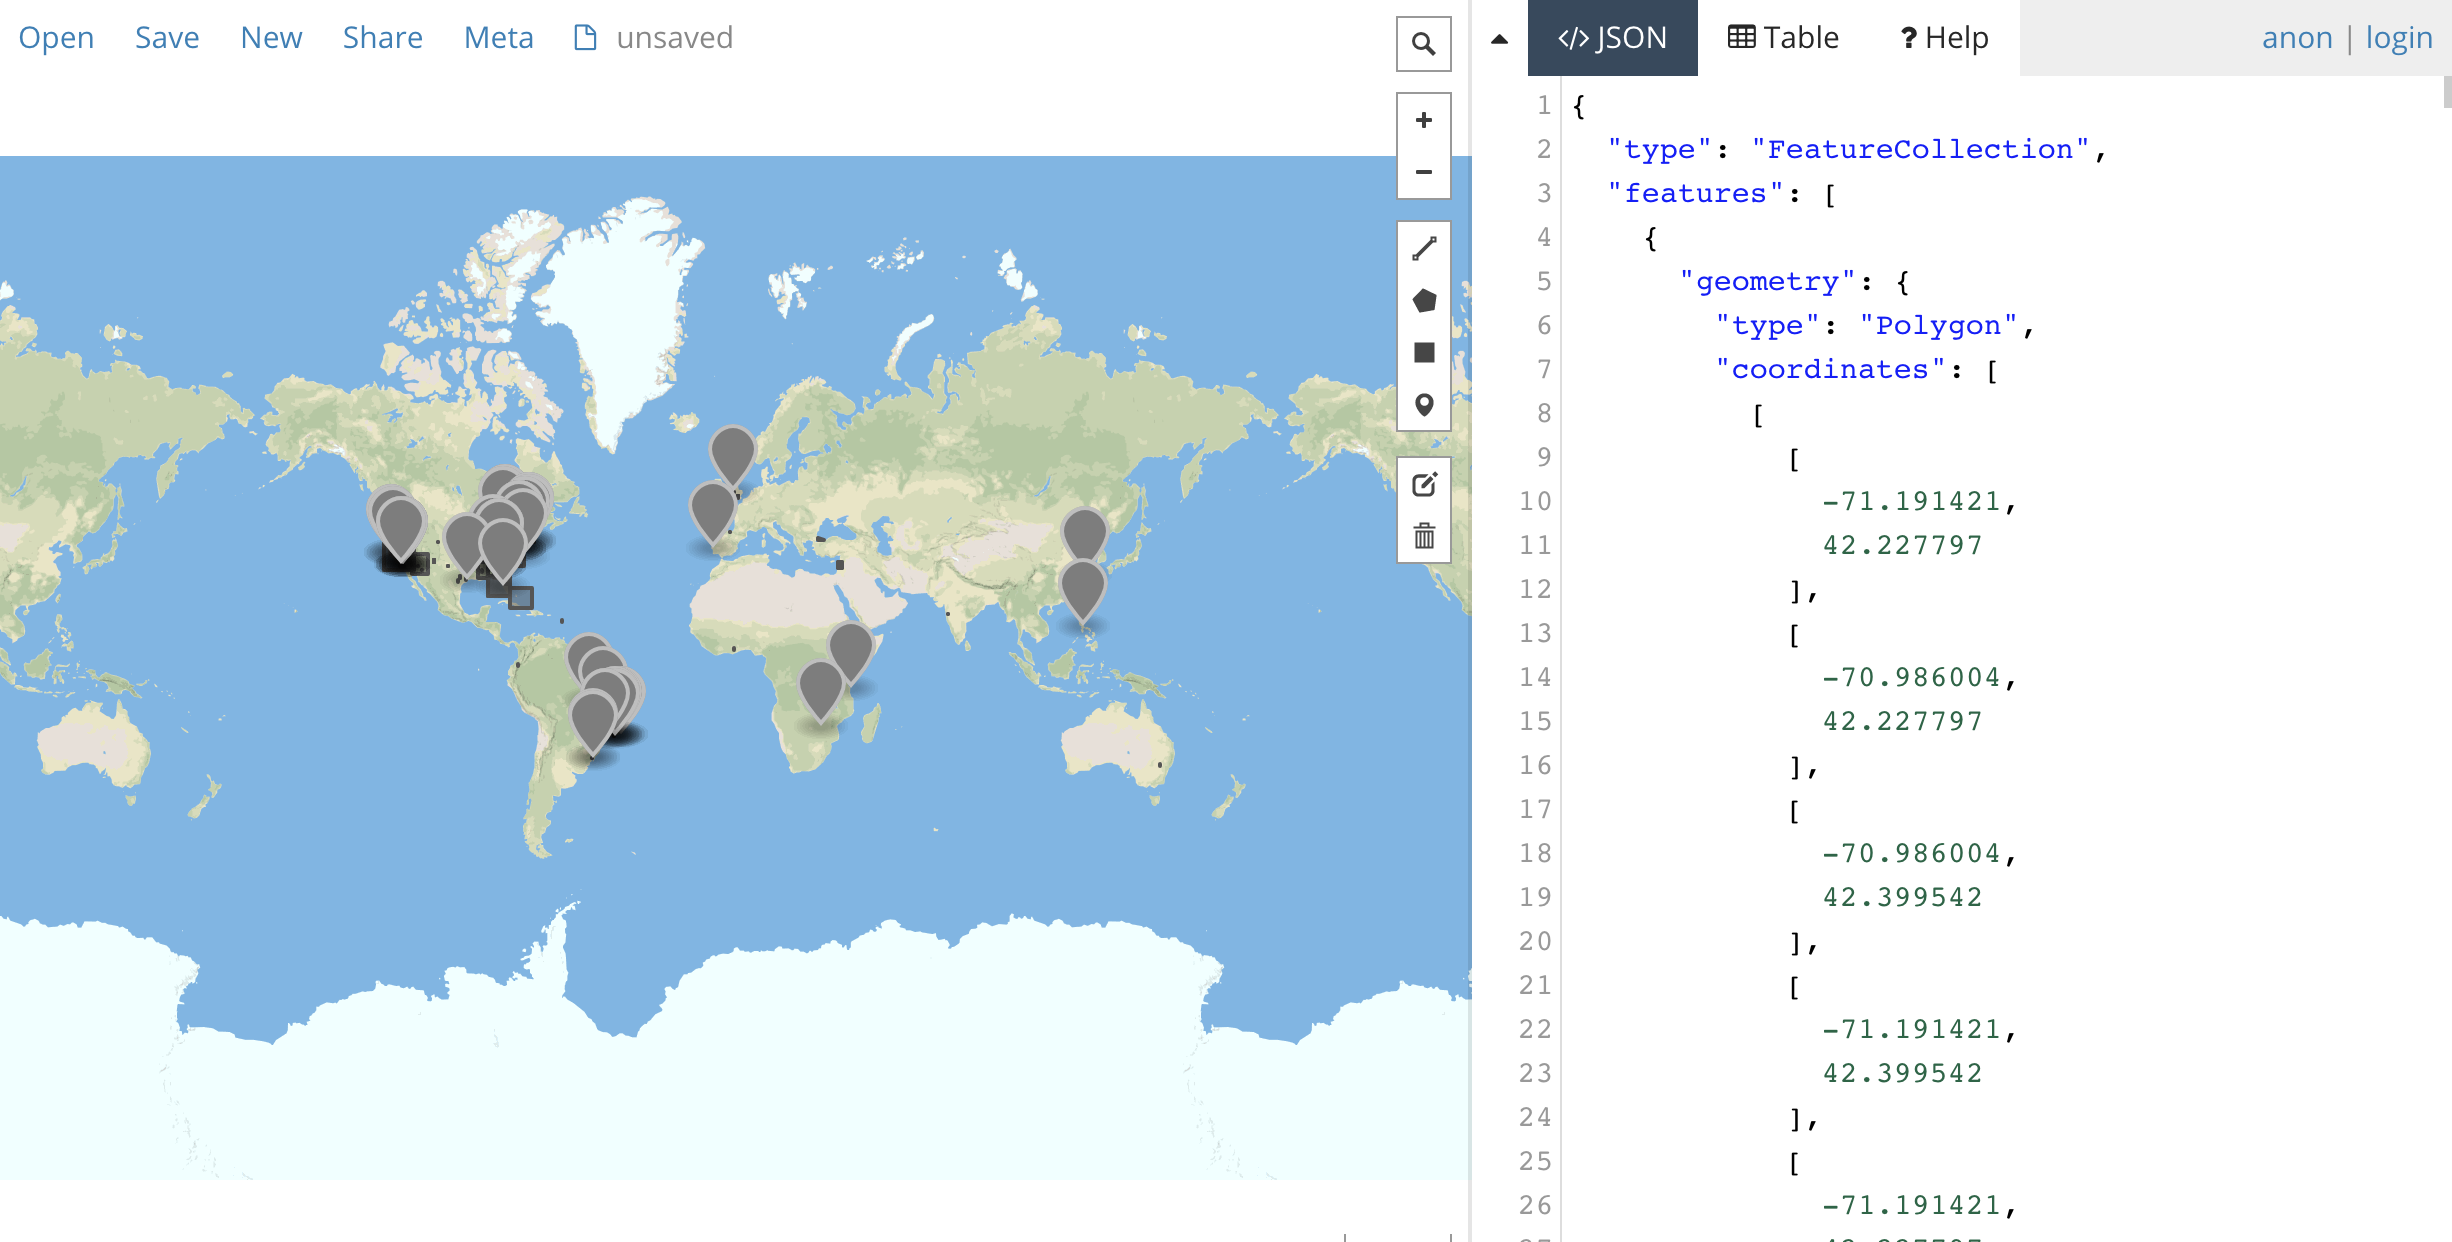
Create Geojson
Use the following command:
utils/geojson.py tweets.jsonl > tweets.geojson
Output: Creates a .geojson file. Quickly create map from geojson file:
- Geojson.io: Drag and Drop your geojson file into the </>JSON left panel to create map:
- With a github account, logged in: https://gist.github.com/, drag geojson file into browser window, and save gist. Will automatically make into a map
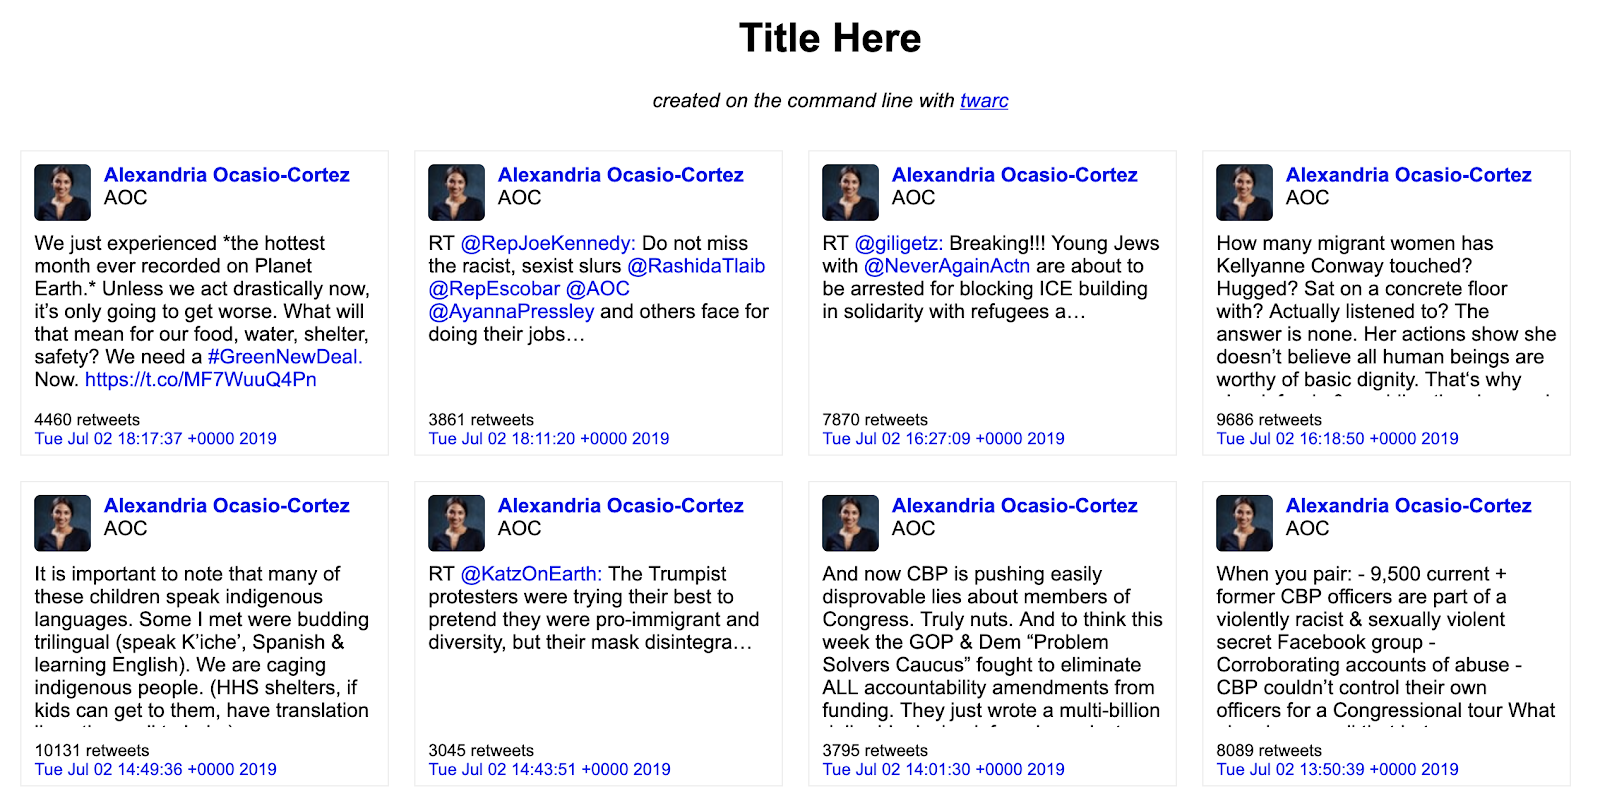
Tweet Wall
Create a wall of tweets, use the following command:
utils/wall.py tweets.jsonl > tweets.html
Output: Creates an html file, open in your browser to view all tweets, easy to browse through.
Media URLs
Creates a text file the URLs of images uploaded to Twitter in a tweet json. Use the following command:
utils/media_urls.py tweets.jsonl > tweets_media.txt
Output: Creates a text document with the tweet ids and media urls.
For just a list of embedded media URLs (without the associated tweet id):
utils/embeds.py tweets.jsonl > tweets_embeds.txt
Remove Retweets from JSONL
Creates a new JSONL file with retweets removed. Use the following command:
utils/noretweets.py tweets.jsonl > tweets_noretweets.jsonl
Sort Tweets Chronologically
Tweet IDs are generated chronologically. This command will sort your tweet data by Tweet ID in ascending order, which is the same as sorting by date:
utils/sort_by_id.py tweets.jsonl > tweets_sorted.jsonl
Once you have a JSONL sorted chronologically, we can identify the first and last tweets in your data set, to establish the time frame of your collection.
To see the first 10 tweets in the dataset (and create a text file to view this data):
head tweets_sorted.jsonl > tweets_head.txt
To see the last 10 tweets in the dataset (and create a text file to view this data):
tail tweets_sorted.jsonl > tweets_tail.txt
Another option is to create a csv, open in Excel and sort the “id” column by ascending and descending order to identify the first and last tweets in your dataset.
Remove Tweets Before Certain Date
You may want to study tweets from only a select number of days in your dataset. For example, you’ve searched a hashtag related to an event that occured within the last two days, but your search query retrieves tweets from the previous seven days.
Use this command to remove tweets occurring before a given date:
utils\filter_date.py --mindate 13-oct-2019 tweets.jsonl > filtered.jsonl
Remove Duplicate Tweets
Creates a new JSONL file with no duplicate tweets. This script removes any tweets with duplicate IDs. Use the following command:
utils/deduplicate.py tweets.jsonl > tweets_deduped.jsonl