GIS: The (rare) Tartan-Plaid Point Dispersion Problem
Have you ever wondered what would happen to your map of points if while converting your coordinates from latitude/longitude in degrees, minutes, seconds (DMS) to decimal degrees (DD) you messed up the math? Ever seen a weird tartan-like plaid pattern emerge on your map from points that were suppose to be uniformly spread out over the known extent? Or wonder why coordinates are much more commonly stored as decimal degrees by computer GIS applications instead of the degrees-minutes-seconds most of us learn growing up? If so, this blog entry from the Scholars’ Lab at the University of Virginia Library is for you!
First a little digression to explain latitude and longitude, and why computer GISs generally prefer decimal degrees when expressing lat/lon as a coordinate pair.
Latitude and Longitude is a spherical coordinate system for describing location upon a sphere (or upon an object that’s approximately a sphere, like the Earth). Just as there are 360 degrees in a circle, there are 360 degrees of longitude (numbered 180 W (-180) to 0 to 180 E (+180) on either side of the Greenwich Prime Meridian) and 360 degrees of latitude (numbered 90 S (-90) to 0 to 90 N (+90) from the south Pole to the Equator (the Prime Parrallel, so to speak) to the North Pole… and back again on the other side of the globe, to complete the circle). Each degree can be subdivided into 60 minutes, and each minute subdivided into 60 seconds. Further subdivision of seconds is expressed as fractions or decimals. Thus you could express the geographic location of the Scholars’ Lab at UVA as being at 38º 02’ 12.3540” N, 78 º 30’ 19.7928” W (or +38º 2’ 12.3540”, -78 º 30’ 19.7928”).
Computer GIS programs all want the northing and easting coordinate pair saved as just two numbers (one number for latitude, one number for longitude) instead of three different fields to contain the degrees, minutes, and seconds for latitude and another three fields for longitude. This makes it much easier for the computer to plot location. Many GIS programs also prefer the coordinates to be ordered longitude, latitude since that mimics X, Y coordinates. Since there are 60 minutes in a degree and 60 seconds in a minute (or 3600 seconds in a degree [60 x 60]), you could write the location of the Scholars’ Lab as -78 – (30/60) – (19.7928/3600), 38 + (02/60) + (12.3540/3600) which is -78.505498°, 38.036765° in decimal degrees.
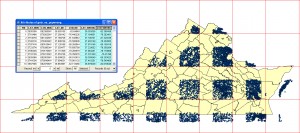
Now back to the emergent tartan-plaid problem. What would happen if instead of converting to decimal degrees, you simple wrote out the degrees-minutes-seconds numbers in the format DD.MMSSssss ? The Scholars Lab location would become -78.30197928, 38.02123540. But the computer GIS would still interpret this as decimal degrees, and would compress all points falling within a 1x1 degree box into just the first 6/10ths x 6/10ths of the box, with a gap without points filling the rest of the box. Spread over a large region, this would result in a tartan plaid-like pattern emerging.
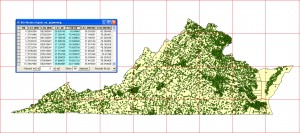
So what is supposed to look like this:
Would end up looking like this:
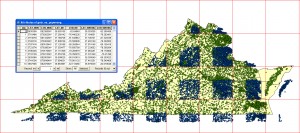
And both the correct and incorrect versions together:
Not that this is a common mistake people using GIS make by any stretch, but when someone has a question about why their points are all coming out misaligned with strange empty striping patterns, it can take a little while to deduce what’s going on if you’ve never seen the results of such a mistake before.


