
Biblical Statistics
The first topic that I chose for my dissertation in UVA’s Department of Religious Studies was the “School of Saint Paul.” I hoped to show the existence of a group of followers who surrounded Paul and engaged with him in the interpretation of the Old Testament. In order to do this, I decided to investigate how Paul used scripture in his epistles and how the followers of Paul used the same scripture in their writings. I anticipated finding certain portions of the Old Testament that either were used exclusively in the Pauline and post-Pauline literature or were used differently in the Pauline and post-Pauline literature than in the rest of the New Testament.
But I had a problem. The fund of Pauline and post-Pauline quotations and allusions to the Old Testament numbered more than 1000 cases. How could I represent such a large set of data in a way that made them easily comprehensible? A friend of mine suggested that I needed to represent the data graphically. And a colleague here at the Scholars’ Lab, where I work as a graduate consultant, advised SPSS as the best way to accomplish such graphical representation.
I already had a table that I had made in Microsoft Word of every usage of the Old Testament in both the Pauline and post-Pauline literature. I needed to get this data into SPSS with as little headache as possible. So, I converted the data into an Excel file, saved this in a format that SPSS could read, and then imported it into SPSS. At that point, I had accomplished the hard part. All that was left to do was to analyze and graphically represent this data. And here is one example of what I produced:
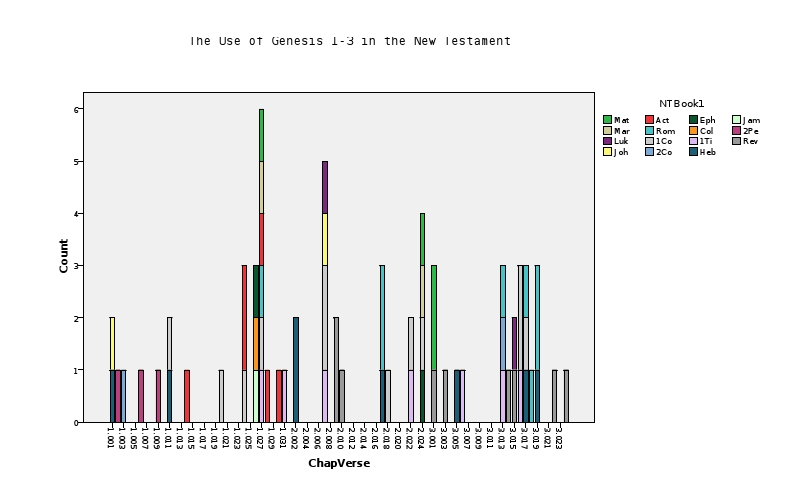
Unfortunately, this analysis of the data made it clear that the evidence was insufficient for my dissertation! I found no significant chunks of the Old Testament that were used exclusively in the Pauline and post-Pauline literature. And I discovered that trying to set the Pauline and post-Pauline use of scripture against that of the rest of the New Testament was speculative, at best. I ended up having to change my dissertation topic. But it was this statistical analysis and work in information visualization that made it clear to me that the evidence was insufficient. Without it, it is possible that I would still be chasing the wild goose that was my previous topic.