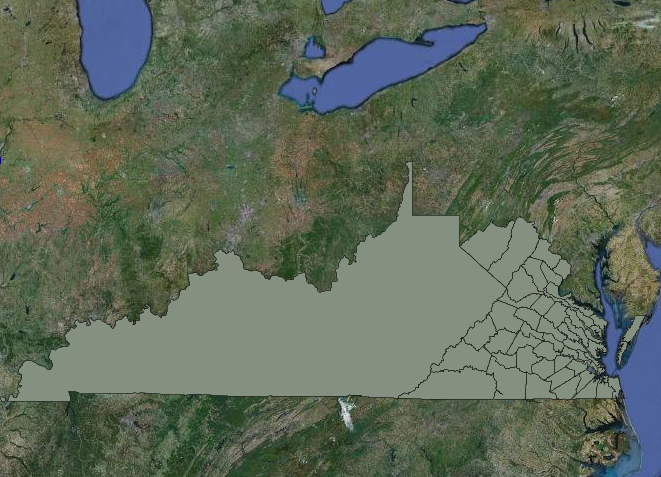
In the Scholars’ Lab we are working with remarkably detailed datasets showing changes to US political boundaries over time. We’ve all been fascinated with visualizations where the familiar outlines of the US states emerge from thousands of boundary changes to their underlying counties over the last few hundred years. Did you know Virginia once spanned from the Atlantic Ocean to the Mississippi River?
We’re developing a new web-based tool for visualizing these historic boundary changes and it’s nearly ready for prime time. We’ll announce the beta release here soon.
So with the knowledge that US state boundaries have already been subject to drastic change over time, let’s have some fun with geographic information systems to visualize drastic mathematically-induced changes to those familiar US state boundaries.
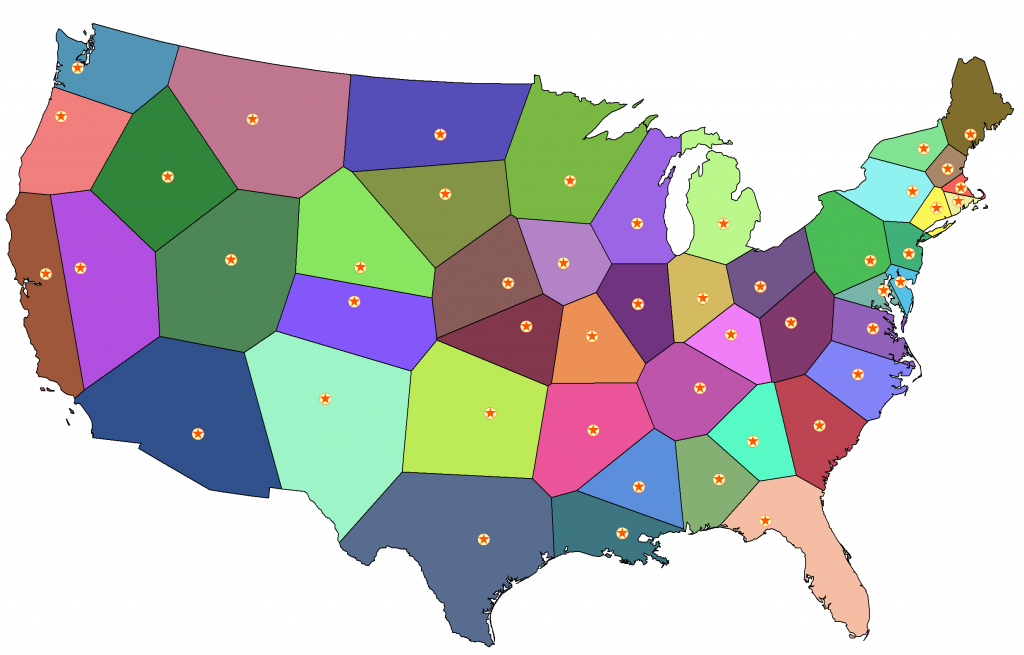
For our experiment, let’s keep all our current state capital cities right where they are since they are laden with the necessary infrastructure of government. But we’ll move the state boundary lines Voronoi-style so anywhere you travel in each of our new states you’ll be closer to the state capital than any other state capital. In other words, when you’re standing anywhere inside our newly outlined Virginia, you will always be closer to the Virginia state capital, Richmond, than any other state capital. That seems very efficient. Let’s have a look.
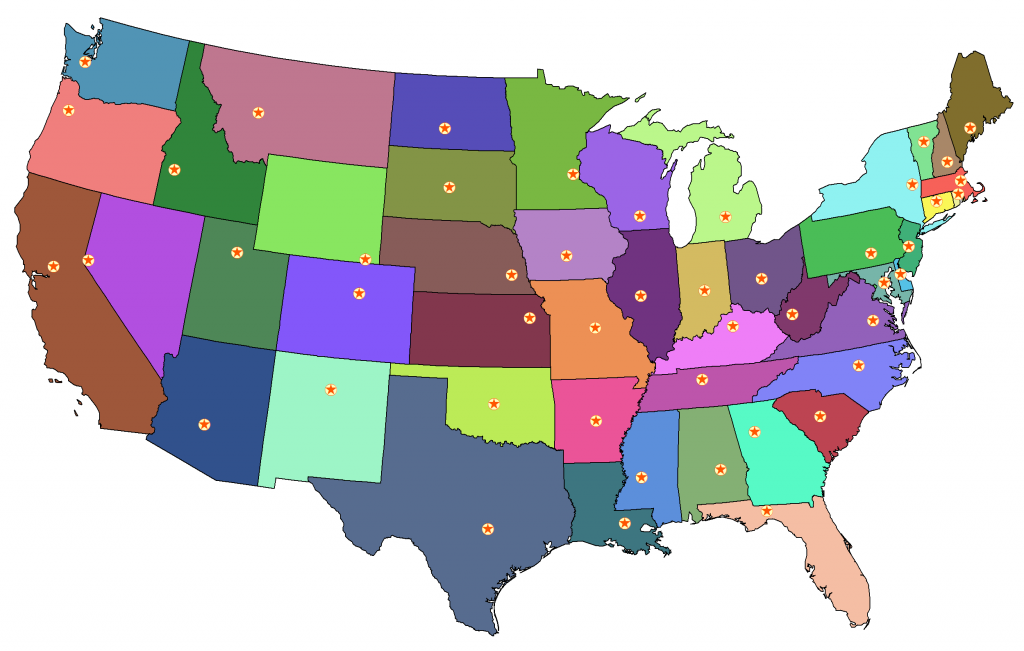
Here’s that familiar grade-school wall map of the lower 48 US states and their capital cities. Now let’s tweak the map with GIS software to reconfigure the states, Voronoi-style.
Wow, what a difference Voronoi makes.
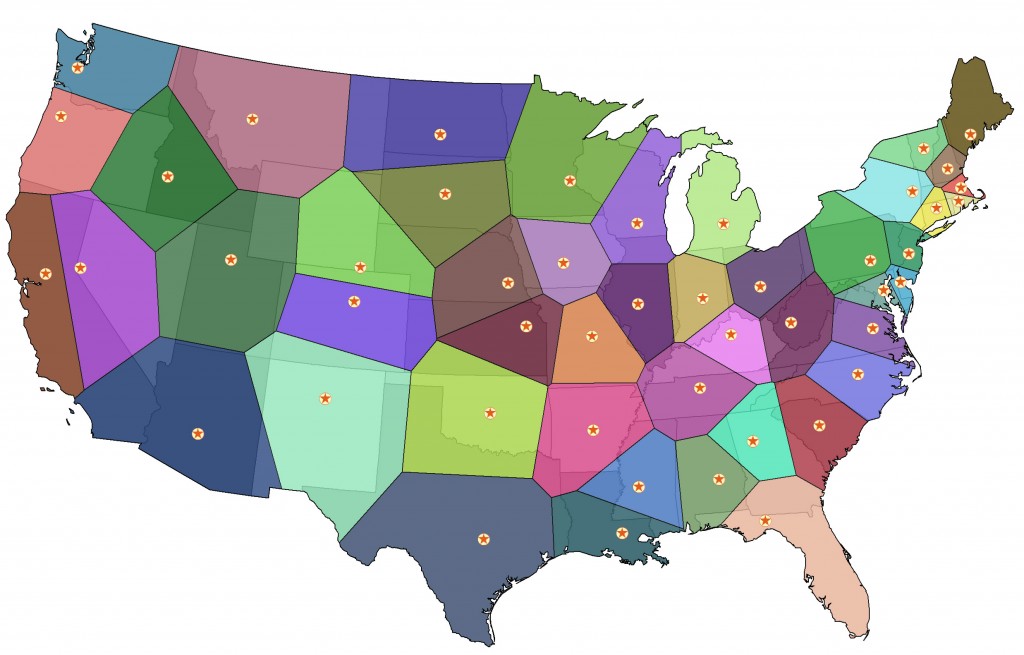
Let’s measure just how much the states have changed in our new layout. In absolute terms, Utah and New Mexico make the biggest land grabs while Texas and California lose the most real estate. But as a percentage of their current area, Rhode Island is the big winner ballooning in size by over 240% while Massachusetts shrinks 60%.
To visualize the state-by-state changes, Todd Burks from neighboring Clemons Library overlayed the two maps.
Intrigued? Read more about Voronoi and Thiessen polygon GIS techniques.


